
TLDR Summary
Optimised ranges and health scores used in consumer biomarker dashboards are not validated clinical measures. Clinical reference ranges are based on large population studies and long-term outcomes. Optimised zones, by contrast, are typically created by individual companies using internal algorithms, small datasets or expert opinion. They can be useful for motivation, but they do not reliably predict better health or improved athletic performance. Their value depends entirely on context and interpretation.
What This Article Covers
- How clinical reference ranges are established
- How optimised ranges differ from medical ranges
- How companies build health scores
- Whether optimised zones are scientifically validated
- Why athletes should be cautious with colour-coded dashboards
- When these tools can help and when they mislead
- Evidence-based recommendations for interpretation
Are Optimised Ranges and Health Scores Real?
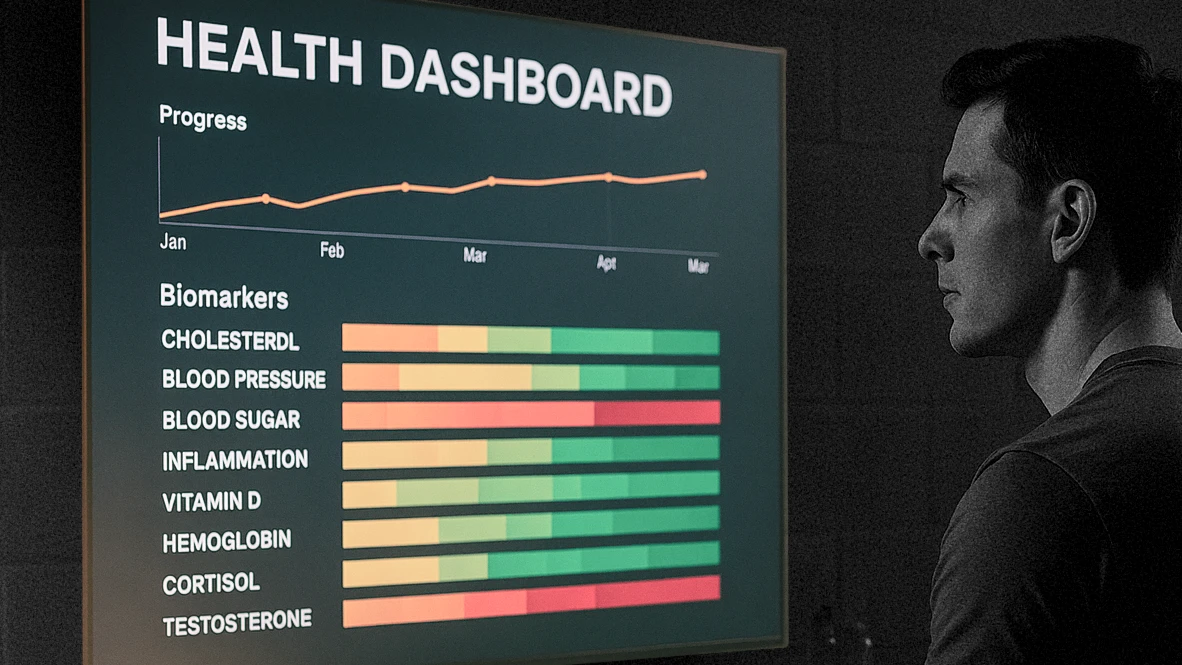
The rise of consumer biomarker testing has introduced a new vocabulary. Instead of traditional lab ranges, users see personalised zones presented as green, yellow or red bands. A single blood result that is clinically normal can suddenly appear sub-optimal. Likewise, a proprietary health score can suggest improvement even when the underlying markers have not changed in meaningful ways.
For athletes, this can create both motivation and unnecessary worry. The question is whether these optimised ranges and composite scores reflect established science or whether they are oversimplified interpretations.
The reality sits somewhere in the middle. The underlying lab tests are usually accurate. The colour-coded interpretation layers are more speculative. They are not fraudulent or deliberately misleading. They simply simplify complex physiology in ways that may not always reflect clinical reality.
What Clinical Reference Ranges Actually Represent
To understand optimised ranges, it helps to understand clinical ranges first.
Clinical reference ranges are usually established by:
- Measuring biomarker values from large groups of healthy individuals
- Using statistical methods to define typical values
- Adjusting for age, sex and population differences
- Validating associations with long-term outcomes such as heart disease, diabetes or mortality
For example, the reference range for HbA1c is based on decades of epidemiological research linking it to diabetes risk. The reference range for ferritin reflects iron metabolism and deficiency risk across diverse populations. These ranges are not arbitrary.
They are backed by:
- peer-reviewed studies
- clinical trials
- national and international guidelines
- regular updates based on new evidence
This rigorous process ensures that clinical ranges reflect what we know about human health through long-term data.
How Optimised Ranges Are Created
Optimised ranges aim to narrow the clinical range into a smaller zone believed to reflect better health. Companies often claim these ranges are personalised. In practice, they are usually based on:
- internal datasets
- expert interpretation
- theoretical models
- or unpublished algorithms
These ranges may be reasonable in concept, but they often lack:
- large study populations
- long-term outcome validation
- peer-reviewed methodology
- transparency in how ranges are defined
For example, a dashboard might present an “optimal” ferritin range of 80 to 120 micrograms per litre. Clinically, iron deficiency is typically defined below 30 and overload above 300. Suggesting a narrow ideal range between 80 and 120 is more interpretive than evidence-based.
These narrow zones may motivate lifestyle changes, but they are not medically validated targets.
How Health Scores Are Constructed
Health scores are composite numbers that summarise all biomarkers into a single figure. This is appealing because it simplifies complexity. The downside is that it hides nuance.
Scores are typically created by:
- assigning weights to different biomarkers
- setting thresholds based on internal rules
- reducing everything to a scale such as 0 to 100
This appears scientific but often reflects subjective decisions:
- Which markers are most important
- How much each marker influences the score
- Which values earn penalties or bonuses
- How trends are interpreted over time
Scores can shift without any meaningful change in health. For example, small changes in a few biomarkers within normal ranges can raise a score even if your overall health is unchanged. Scores can also fall due to training-induced fluctuations even when you are improving fitness.
In short, health scores are interpretive tools rather than scientific measurements.
Do Optimised Ranges Predict Better Health Outcomes?
There is limited evidence that being inside a consumer-defined optimal range predicts better health or performance compared with being inside the standard clinical range.
To be considered valid, an optimised range would need:
- large population studies
- long-term follow-up
- comparison with standard ranges
- clear evidence of improved outcomes
These studies do not yet exist in this space.
Some ranges may be directionally reasonable. For example, aiming for lower ApoB levels than the general population is supported by cardiovascular research. But most consumer-defined ranges lack outcome-based justification.
This does not mean they are useless. It means they should be interpreted as suggestions rather than scientific truths.
Why Athletes Are Particularly Vulnerable to Misinterpretation
Athletes have unique physiology. Training can influence biomarkers significantly:
- Heavy training can raise liver enzymes
- Endurance work can depress immune markers temporarily
- Intense sessions can raise hs-CRP
- Early morning blood draws can show high cortisol
- Low carbohydrate phases can alter thyroid markers
All of these can appear sub-optimal on dashboards even when they reflect normal athletic adaptation.
This is important. Many anomalies that appear alarming in athletes are harmless and temporary. An optimised range does not know the context of your training plan.
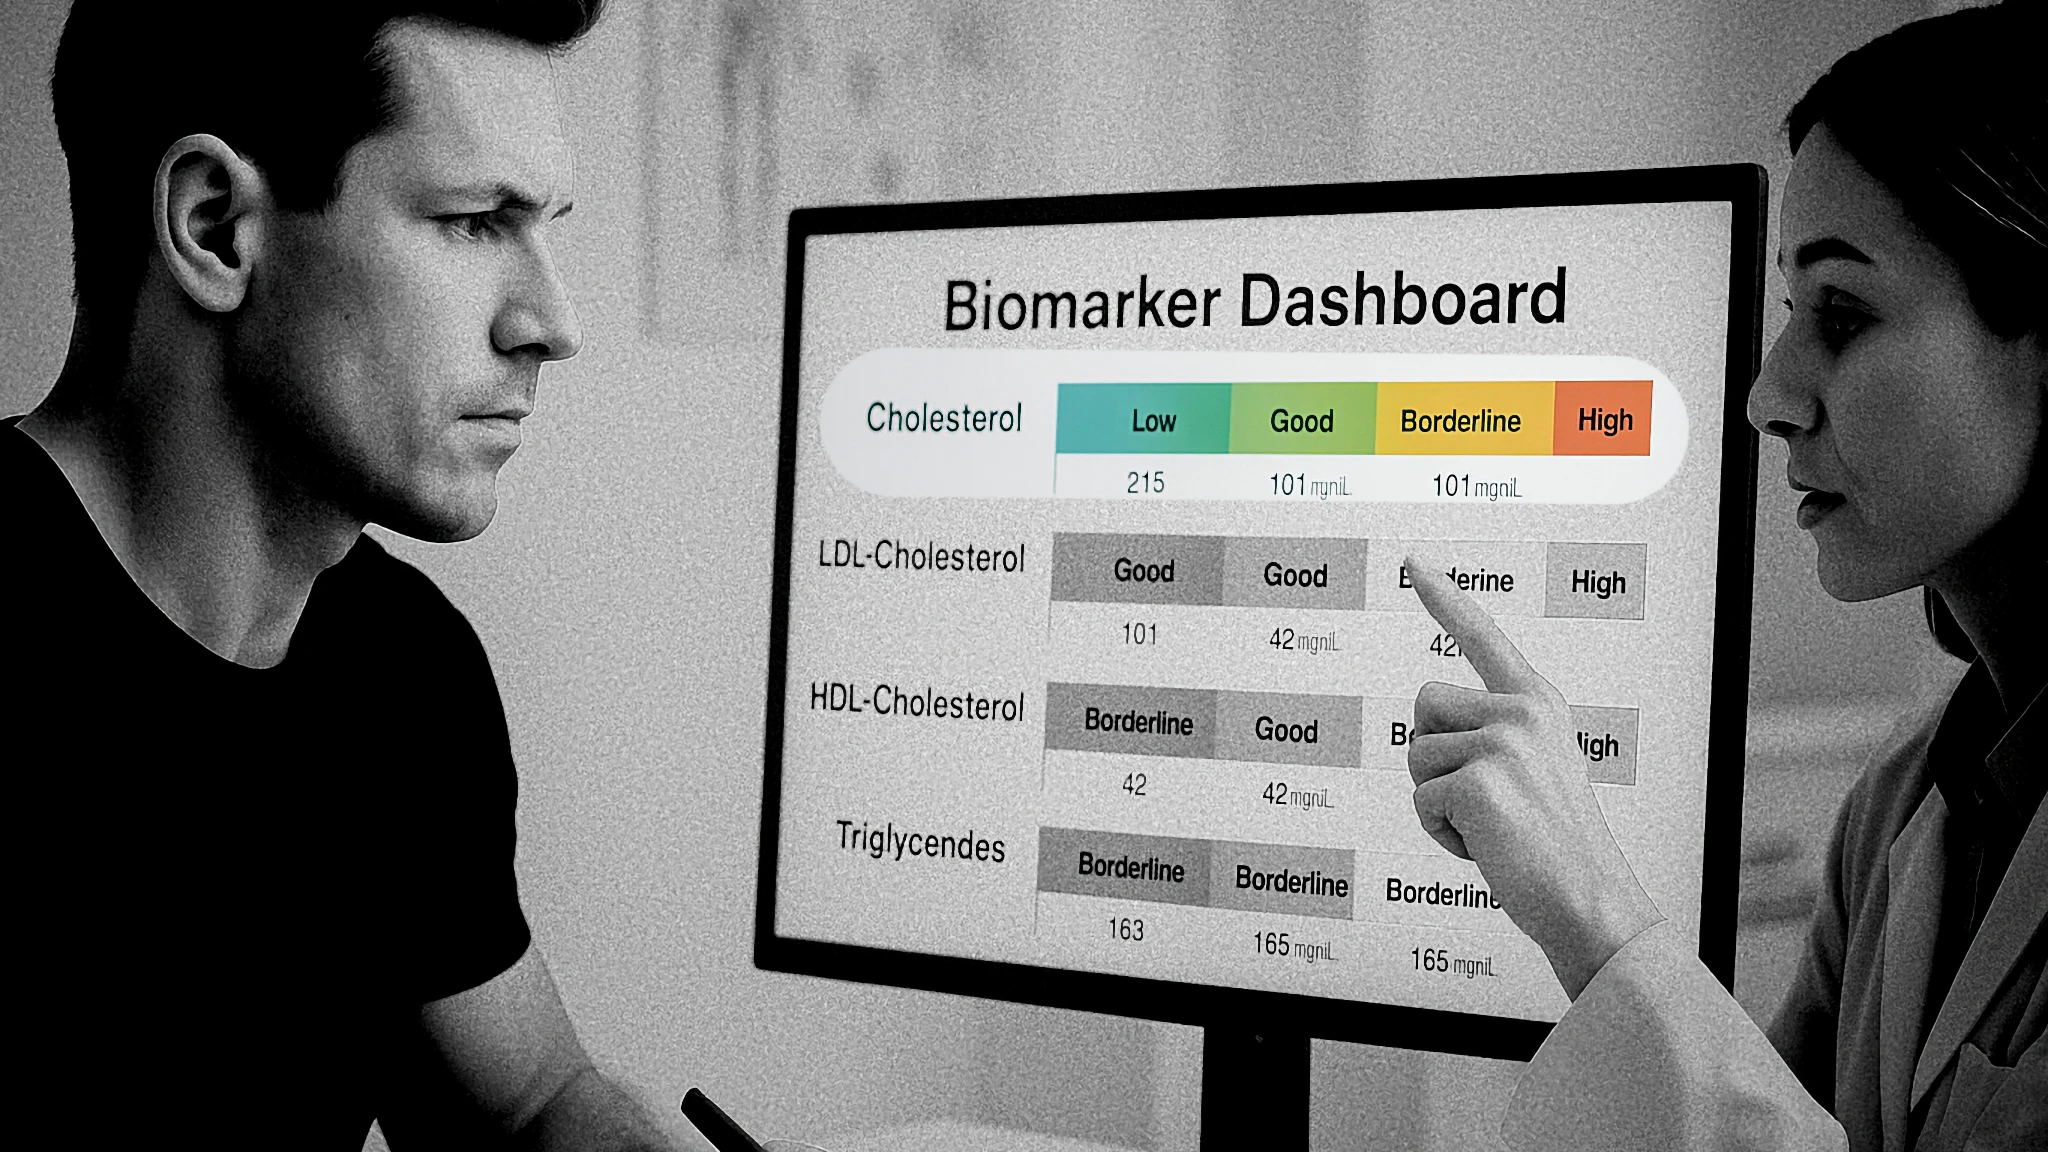
Why Colour-Coded Dashboards Can Be Misleading
Dashboard colours create cognitive shortcuts:
- Green equals good
- Yellow equals concern
- Red equals problem
This is powerful from a UX perspective, but it can oversimplify complexity.
A mild deviation from an optimised range might be:
- completely normal
- expected based on training load
- within clinical normal
- insignificant
Yet the visual presentation can create unnecessary urgency.
Athletes often find themselves chasing green zones rather than training goals. This diverts attention from behaviours that drive real improvement such as sleep, nutrition and recovery.
When Optimised Ranges and Scores Can Be Helpful
Despite limitations, optimised ranges and health scores can help when used correctly.
Motivation
Some individuals find dashboards motivating and use them to stay consistent with training and nutrition habits.
Baseline tracking
Scores can help highlight major shifts in health if tracked over time.
Conversation starters
They can prompt useful discussions with clinicians.
Awareness
They help people notice trends that might otherwise be ignored.
The key is recognising that optimised ranges are tools, not diagnoses.
How Athletes Should Use These Tools Safely
Focus on consistently validated biomarkers
Iron, B12, HbA1c, thyroid, lipids.
Judge results in the context of training
A single raised inflammation marker after a tough week is expected.
Use clinical reference ranges as the primary benchmark
Optimised ranges are supplementary.
Do not chase green zones for the sake of it
Focus on recovery, nutrition and programmed training.
Seek professional interpretation
A sports physician or dietitian provides essential context.
Internal RB100 Links
External Authoritative Sources
Final Summary
Optimised ranges and health scores look scientific but are not validated clinical standards. They can provide motivation and awareness, but they should not be treated as definitive indicators of health or performance. Athletes should rely on clinical ranges, context and professional interpretation. Deep testing is a tool, not a guarantee of improved health.